Staring at the Screen: My Embarrassing Start with Flashing Numbers
Staring at a flashing trading screen for the first time feels like trying to read an alien language. You see green and red bars dancing around, and suddenly, your hard-earned cash feels like it's sitting on a roulette table. I have been exactly where you are—sweating over every tiny price dip and wondering if the market was just rigged against normal people. Let us fix that today by breaking down these messy charts into simple, bite-sized pieces you can actually use.
I eagerly logged into the platform, expecting to see a simple layout that would tell me exactly what to buy. Instead, I stared at the screen, and my heart sank immediately.
Red and green bars were jumping around wildly like a broken video game. I felt completely stupid, thinking I could just guess my way into making a consistent profit.
My hard-earned savings were on the line, and I was basically gambling blindly.

The anxiety kept me up at night, wondering if the market would crash while I slept. I found myself checking my phone every five minutes during dinner, totally ignoring my family.
Every time I saw a red line dip lower, my stomach tied itself into tight knots.
They want to build a better future for their families, but the overwhelming charts make them feel inadequate.
You may end up buying when prices are high out of pure excitement and selling when prices drop out of sheer panic. It can feel like the entire stock market is a rigged game designed to take your money.
But it does not have to be this miserable. You just need a simple, logical way to translate those messy lines into a language you can actually understand.
Before You Read: My 3 Golden Rules for Charting
-
Keep it clean: You do not need 15 messy indicators to make money. Stick to price action and volume first.
-
Wait for the bounce: Never try to catch a falling stock. Let it hit the floor and prove it is ready to go back up.
-
Zoom out: Always check the daily or weekly charts before making a move so you know the big picture.
Translating the Market: Breaking Down the Chaos
Think of a stock chart exactly like a medical heart monitor in a hospital. When you first look at an EKG machine, it can look like a bunch of random, scary scribbles.
But to a trained doctor, those tiny bumps and dips tell a clear story about the patient's health. In the financial world, a price chart tells you the historical price behavior of a specific company.
It also reflects the emotions of market participants, including fear, optimism, and greed. Once you learn how to read these patterns, the stock market can become much less intimidating.
To make things super simple, here is a quick breakdown of how I mentally translate chart patterns before I ever risk a dollar:
| What the Chart Shows | What My Brain Translates | My Immediate Action |
| Big Green Candle + High Volume | Big money players are buying aggressively. | I look for a safe spot to ride the wave upward. |
| Big Red Candle + High Volume | Serious panic. Everyone is running for the exit. | I stay away or look to protect my current money. |
| Lots of tiny, flat candles | The market is taking a nap. Nobody is in control. | I sit on my hands and wait. Doing nothing is a valid strategy. |
Breaking the Biggest Charting Myths
Before getting into the practical steps, it is important to clear up some common misconceptions. Many beginners struggle because they hold false beliefs about how trading and chart analysis work.
Here is a quick reality check.
| The Common Myth | The Honest Reality |
|---|---|
| Charts predict the exact future perfectly. | Charts only show probabilities based on past price behavior. |
| You need to be a math genius to trade. | Basic logic, patience, and visual pattern recognition are useful starting points. |
| More indicators mean better results. | A clean chart with price and volume can often be easier to understand. |
Now that we have cleared away some of the mental clutter, let us look at practical ways to read a stock chart.
These concepts can help you understand what price movements may be showing rather than simply guessing.
Decoding the Language of Candlesticks
The foundation of reading a stock price chart is understanding the Japanese candlestick. A candlestick is a visual representation of the price movement during a specific timeframe.
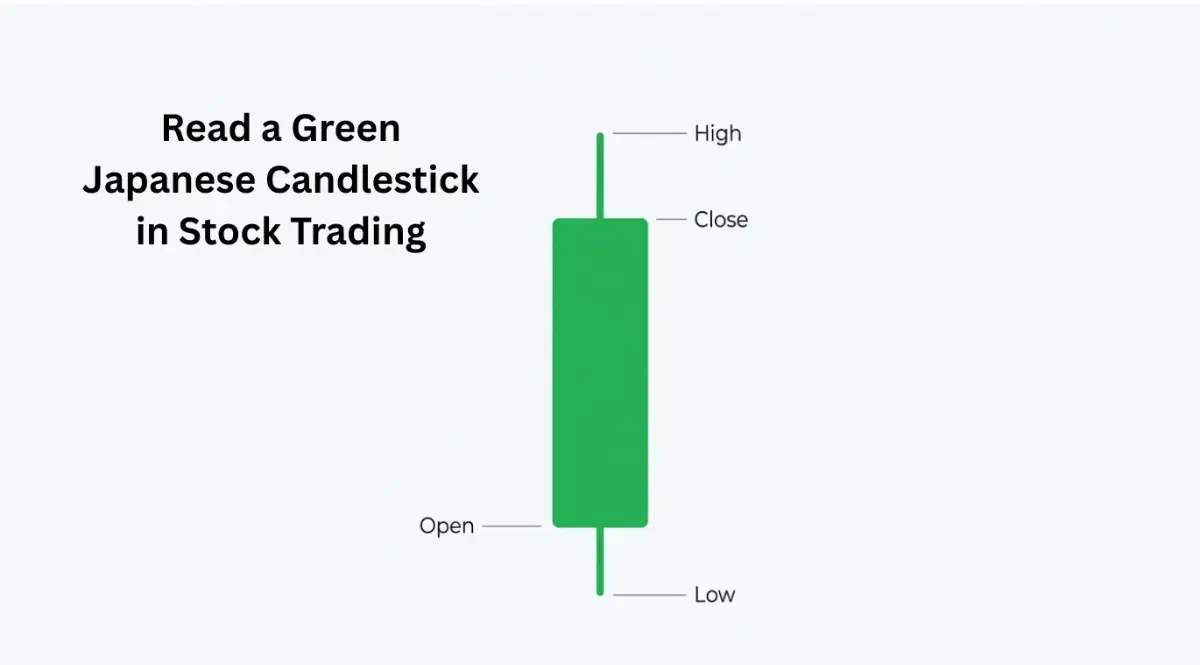
For example, on a daily chart, one candle represents one full trading day.
The Body of the Candle
The thick part of the candlestick is called the body. It shows the opening price and the closing price for that particular period.
If the body is green or white, the closing price was higher than the opening price. If the body is red or black, the closing price was lower than the opening price.
This simple difference gives you an immediate idea of whether buyers or sellers controlled that period.
The Wicks and Tails
You will often see thin lines extending above and below the candle body. These lines are called wicks or shadows.
They represent the highest and lowest prices reached during that period. A long upper wick can show that buyers pushed the price higher but sellers later pushed it back down.
A long lower wick can show that the price moved lower before buyers stepped in and pushed it upward. I used to ignore these thin lines because I thought only the thick colored body mattered.
My personal realization came after losing a big trade. I finally noticed that a long bottom wick can provide useful information about buying pressure near lower prices.
Now, I pay attention to the story those small shadows may be showing.
Identifying the Flow of the River
Trying to trade against the main trend is similar to trying to swim upstream in a rushing river. You might make some progress, but the current can make the journey much harder.
A stock chart can show you the general direction in which price has been moving.
The Uptrend
An uptrend can be easier to identify when the price repeatedly creates higher highs and higher lows. The price moves upward, pulls back slightly, and then reaches another higher level.
As long as this pattern continues, the market is showing sustained upward movement.
The Downtrend
A downtrend can look like a ball rolling down a bumpy hill. The price drops to a new low, then bounces upward slightly.
However, the bounce fails to reach the previous peak. This creates a pattern of lower lows and lower highs.
It indicates that selling pressure has been stronger during that period.
The Sideways Market
Sometimes buyers and sellers are relatively balanced.
The price may move back and forth within a relatively narrow range without establishing a clear upward or downward direction.
This is called a sideways or range-bound market. For beginners, such conditions can sometimes be more difficult to interpret because there is no obvious trend.
Watch This Expert Breakdown to See It in Action!
If you are struggling to picture these trends, a visual explanation can make the concept easier to understand.
Finding the Invisible Floors and Ceilings
One of the practical concepts in chart reading is identifying support and resistance levels.
These are price areas where buying or selling pressure may cause the price to slow down, stop, or reverse.
Support Is the Floor

Imagine dropping a bouncy ball onto the floor. The ball falls, hits the floor, and bounces upward.
In the stock market, support is a price area where a falling stock may stop declining and begin moving upward. This can happen when investors believe the price has become attractive enough to buy.
The resulting buying pressure can help prevent the price from falling further.
Resistance Is the Ceiling
Now imagine throwing the same bouncy ball toward a ceiling. It reaches the ceiling and then falls back down.
Resistance is a price area where a rising stock may struggle to move higher.
This can happen when investors decide that the current price is high enough to take profits or sell.
The resulting selling pressure can slow or reverse the upward movement.
When you identify these potential floors and ceilings, you can better understand where price has historically struggled to move through.
However, support and resistance are not guarantees that a price will reverse.
They are areas to watch as part of a broader analysis.
Listening to the Volume
Many beginners focus almost entirely on price and overlook another important part of the chart: volume. At the bottom of many stock charts, you will see a series of vertical bars.
These bars represent the number of shares traded during a specific period. Volume can provide additional context about a price movement.
For example, if a stock price suddenly rises significantly, checking the volume can help you understand whether trading activity also increased.
High Volume Means Stronger Participation
If a price movement occurs alongside significantly higher trading volume, it means more market participants were involved in that move.
Large institutions, professional traders, and individual investors can all contribute to higher volume. Higher volume does not guarantee that a price movement will continue.
However, it can provide useful confirmation that substantial trading activity accompanied the move.
Low Volume Is a Warning Sign
If a stock price moves sharply while trading volume remains relatively low, you may want to examine the move more carefully.
Low volume means fewer shares changed hands during that period. This does not automatically mean that the price will collapse.
It simply means the price movement occurred with less trading activity than a move accompanied by heavy volume.
Always remember that price tells you what is happening, while volume provides additional information about the level of trading activity behind that movement.
A Real-Life Example: The Restaurant Parking Lot
Think of volume just like a restaurant's parking lot. If someone tells you a new burger joint is the best in town (the price is going up), but you drive by and their parking lot is completely empty (low volume), you might doubt their claim. However, if there is a massive line out the door and cars are fighting for parking spaces (high volume), you instantly know the hype is real. I use this exact logic every time I look at a stock.
The Power of Moving Averages
As a beginner, looking at raw daily price bars can sometimes feel overwhelming. Charts can look extremely choppy, making it difficult to see the broader direction.
This is where a simple tool called a Moving Average can help. A moving average calculates the average closing price over a selected number of periods and displays it as a smoother line.
Instead of focusing on every individual price movement, you can use the line to observe the broader direction.
The 50-Day and 200-Day Lines
The 50-day moving average is commonly used to observe medium-term price behavior.
The 200-day moving average is often used to examine longer-term price trends.
If the current stock price remains above a moving average, it may indicate that prices have generally remained stronger than the selected historical average.
If the price moves below a moving average, it may indicate that the recent price has weakened relative to that average.
However, moving averages are indicators rather than guarantees.
They should be considered alongside other information instead of being treated as automatic buy or sell signals.
Putting the Puzzle Pieces Together
Reading a stock price chart is not about relying on one single trick. It is about combining several pieces of information to build a clearer picture of what the market may be doing.
Start by looking at the candlesticks. They can help you understand the battle between buyers and sellers during each period.
Then zoom out and identify the broader trend.
Ask whether the price is generally creating higher highs and higher lows, lower highs and lower lows, or moving sideways.
Next, identify potential support and resistance areas. These can help you recognize price levels where the market has previously shown stronger buying or selling activity.
Finally, check the volume. Volume can provide additional context about how much trading activity accompanied a particular price movement.
When several pieces of information point in the same direction, you may have a stronger basis for analyzing the setup.
However, no chart pattern can guarantee a profitable outcome. Markets can behave unexpectedly, and technical analysis always involves uncertainty.
The goal is not to predict the future perfectly.
Instead, the goal is to understand the information available and make decisions based on a clear and consistent process.
With practice, you can become more comfortable reading charts without allowing every red or green candle to trigger an emotional reaction.
Learning to read stock charts takes time, just like learning to ride a bicycle.
At first, the screen may look confusing.
But as you practice identifying candlesticks, trends, support, resistance, volume, and moving averages, the chart can gradually become easier to understand.
Once you learn to recognize these basic patterns, you may never look at a confusing stock chart in quite the same way again.
Leveling Up Your Chart Reading Skills
Once you understand the basic language of candlesticks and volume, you might feel the urge to jump right into the market.
But holding onto long-term success requires a bit more nuance and strategy. The most successful investors do not just look at a single timeframe to make their decisions.
They use a technique called "Multiple Timeframe Analysis," which is like looking at a map through different lenses. Imagine you are trying to navigate through a dense forest using a map on your phone.
If you zoom all the way in, you can see the individual trees and small dirt paths right in front of you. This is exactly what looking at a 5-minute or 15-minute stock chart feels like.
It gives you great detail for the immediate moment, but you have no idea where the overall forest ends.
If you zoom out to a daily or weekly chart, you can clearly see the mountains, rivers, and the exact edge of the forest.
Before you make any financial decision, you should always check the weekly chart to understand the big picture.
If the weekly chart shows a massive downtrend, buying on a 5-minute uptrend is a highly dangerous game.
You always want the overall wind at your back, pushing your trade in the right direction.
Another major secret professional traders use is waiting for true confirmation instead of predicting.
Amateurs love to guess exactly where a stock will stop falling and turn around.
They will draw a support line and blindly buy the exact second the price touches that imaginary floor.
However, smart investors know that sometimes floors break, sending the stock crashing into the basement.
Instead of guessing, they wait for the price to hit the floor, bounce up gracefully, and show a strong green candlestick.
They combine this visual bounce with high trading volume to confirm that big institutions are actually buying.
This simple act of waiting for proof removes so much anxiety from the entire process.
If you want a deeper dive into these core market concepts, understanding how stock trading actually works will give you a massive advantage.
You also need to understand that the market is heavily influenced by big economic rules and regulations.
Spending a little time learning how the market is regulated helps you understand why big institutions move their money a certain way.
The more you understand the underlying mechanics, the less a stock chart will look like random noise.

The Dangerous Traps Waiting for New Investors
Even with a solid strategy, the stock market is full of psychological traps designed to test your discipline.
The biggest mistake I see beginners make is what I call the "Spaghetti Chart Syndrome."
When you first discover technical analysis, it is incredibly tempting to add every single indicator you can find.
You throw on five different moving averages, an RSI line, MACD bars, and Bollinger Bands.
Suddenly, your beautiful price chart looks like a messy plate of colorful neon noodles.
You can barely even see the actual candlesticks hidden behind all those messy math lines.
This completely paralyzes your decision-making because one indicator will tell you to buy while another screams at you to sell.
The most profitable traders in the world keep their screens incredibly clean and minimal.
They focus heavily on price action, volume, and maybe one or two moving averages to guide them.
Another massive pitfall is the emotional habit of "catching a falling knife."
Imagine a sharp kitchen knife slips off your counter and falls rapidly toward the floor.
Your natural reflex might be to reach out and catch it, but doing so will only result in a bloody hand.
In the market, this happens when a stock is aggressively crashing down in a steep downtrend.
New traders look at the massive price drop and think the stock is suddenly a brilliant bargain.
They buy shares while the stock is still plummeting, hoping to predict the absolute bottom.
Most of the time, the stock just keeps falling, completely wiping out their hard-earned savings.
Instead of catching a falling knife, you must wait for the knife to hit the floor and stop moving entirely.
If you are ever confused about these market dynamics, revisiting a beginner's guide to trading stocks can quickly refresh your memory.
Furthermore, many beginners completely ignore the importance of protecting their downside risk.
They become so obsessed with how much money they can make that they forget about the money they can lose.
This often leads people to borrow money from their broker to buy more shares than they can actually afford.
If you ever plan to borrow funds, you must thoroughly educate yourself on the risks of trading on margin before clicking a single button.
Margin can amplify your profits, but it can also put you in massive debt if a single chart reading goes wrong.
Finally, the most heartbreaking mistake is holding onto a losing position out of pure stubbornness.
You buy a stock expecting it to go up, but it immediately breaks right through your support floor.
Instead of accepting a small, manageable loss, you hold onto the shares and pray for a miraculous recovery.
Hope is a wonderful thing in everyday life, but it is an absolute poison when reading financial charts.
If the chart pattern breaks, you must accept the reality and exit the trade to protect your capital.
Your New Action Plan for Market Success
Learning to read a stock price chart is honestly like learning to read sheet music for the first time.
At first glance, it is just a confusing jumble of lines, dots, and weird symbols that make no sense.
But as you practice, your brain slowly starts to recognize the patterns and the rhythm of the market.
You start to see the beautiful, flowing story of human psychology playing out on your screen.
You no longer have to rely on shady internet rumors or loud television pundits to tell you what to do with your money.
By mastering candlesticks, trends, and volume, you take full control of your own financial destiny.
You learn how to wait patiently for the perfect setup, just like a lion waiting in the tall grass.
Remember to keep your charts clean, respect the invisible floors and ceilings, and never try to fight a strong trend.
If you ever feel lost or overwhelmed, simply step back and review the basic mechanics of the stock market to ground yourself again.
It is also highly recommended to read up on historical market behavior studies to see how these exact same chart patterns have repeated for decades.
Human emotions like fear and greed never change, which is exactly why chart reading will always remain effective.
The path to consistent profitability is not about being the smartest person in the room.
It is entirely about building strict discipline, managing your risks, and following the visual clues the market generously provides.
I know exactly how intimidating those flashing red and green numbers feel when you are first starting out. My biggest breakthrough happened when I finally stopped trying to predict the market and simply started reacting to what the charts were actually showing me. Keep your strategy incredibly simple, protect your capital fiercely, and your confidence will grow every single time you look at a screen.
Common Questions About Reading Stock Charts
What is the best timeframe for a beginner to use?
When you are just starting out, a daily chart is usually the absolute best and safest option. It removes all the chaotic intraday noise and gives you a very clear picture of the true trend. Once you master the daily chart, you can slowly begin exploring shorter timeframes.
Do I need expensive software to read charts properly?
Absolutely not. There are dozens of fantastic free charting platforms available online that offer everything a beginner needs. You can easily draw your support lines, view volume bars, and add basic moving averages without spending a single dime.
Why do some candlesticks have no wicks at all?
A candlestick without wicks is often called a "Marubozu" in technical trading language. It simply means the buyers or sellers were so incredibly dominant that the price never retreated from its opening or closing level. This usually indicates extreme strength and conviction in that specific direction.
Can I use chart patterns for long-term investing, or is it just for day trading?
Chart reading is highly effective for long-term investing as well. Even if you plan to hold a company for decades, looking at a monthly or weekly chart helps you find the absolute best entry price. It prevents you from accidentally buying at the peak of a massive, overextended bubble.
What should I do if a stock chart looks completely chaotic and unpredictable?
If a chart looks messy, choppy, and makes zero logical sense to you, the best action is to do nothing at all. There are thousands of publicly traded companies out there to choose from. Simply close that specific chart and move on until you find a beautiful, easy-to-read setup.
Disclaimer:
The information provided in this article is strictly for educational and informational purposes only and does not constitute financial, investment, or legal advice. Trading stocks involves a high degree of risk, and you can potentially lose some or all of your initial investment. Always conduct your own thorough research or consult with a licensed financial advisor before making any investment decisions. Past performance of any chart pattern or trading strategy is never a reliable indicator of future results.